Chart & Analysis Tools
Overview
The E8 Markets chart area is powered by TradingView and supports a full suite of technical analysis tools, indicators, drawing tools, and keyboard shortcuts. This part of the terminal is largely unchanged in substance from the previous documentation; the differences are mostly in exact labels and a couple of new toolbar icons.
Q: How do I change the chart timeframe (interval)?
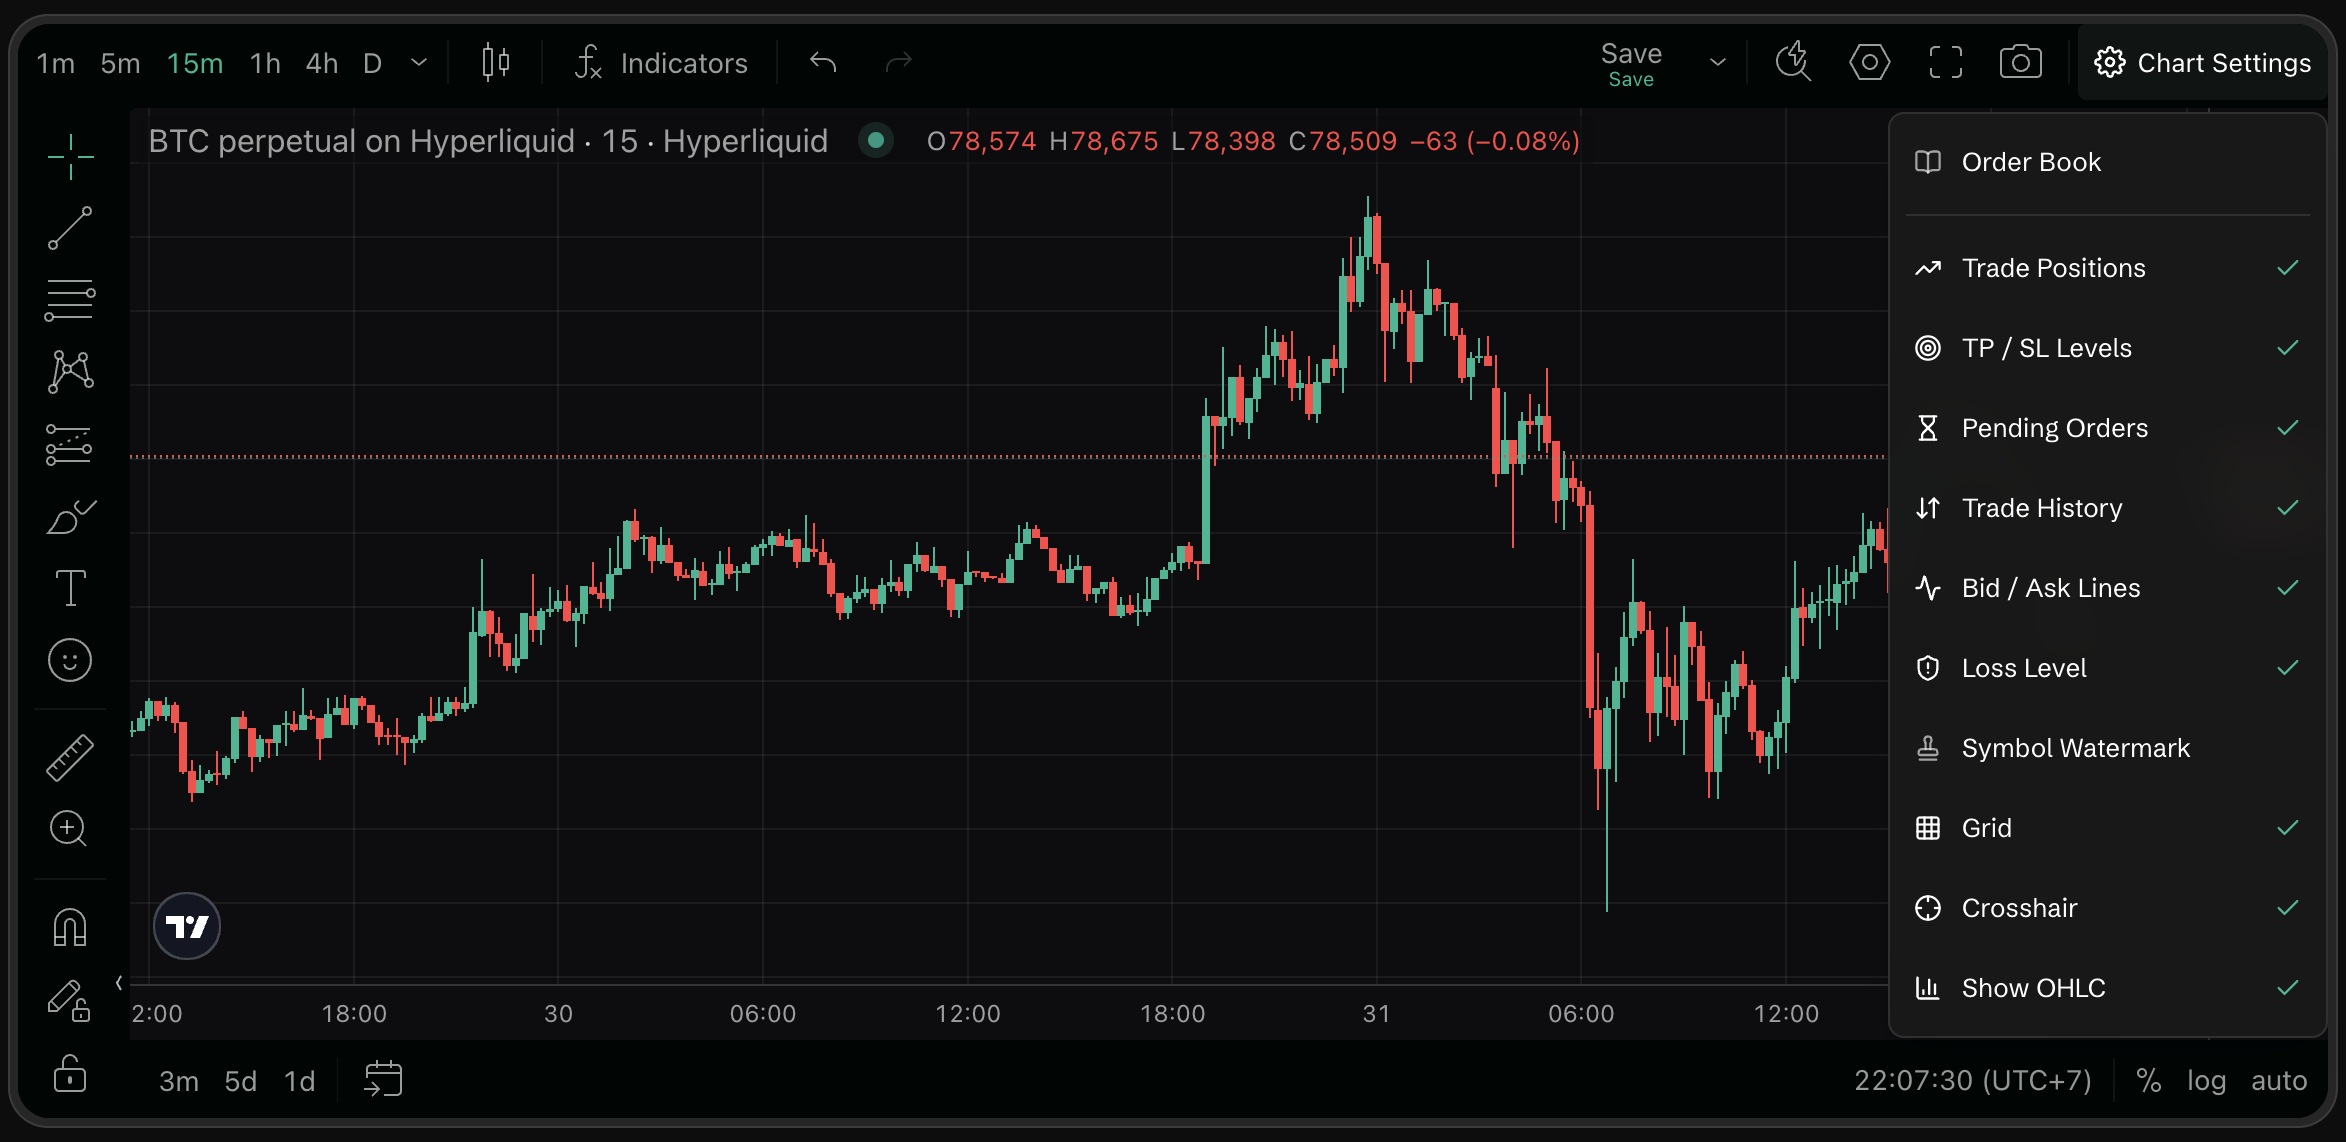
A: Use the interval selector at the top of the chart: 1m, 5m, 15m, 1h, 4h, D, plus a chevron for the full list (which also groups them as Minutes / Hours / Days). You can also use your keyboard number keys to switch intervals quickly while the chart is focused.
Q: How do I add indicators to the chart?
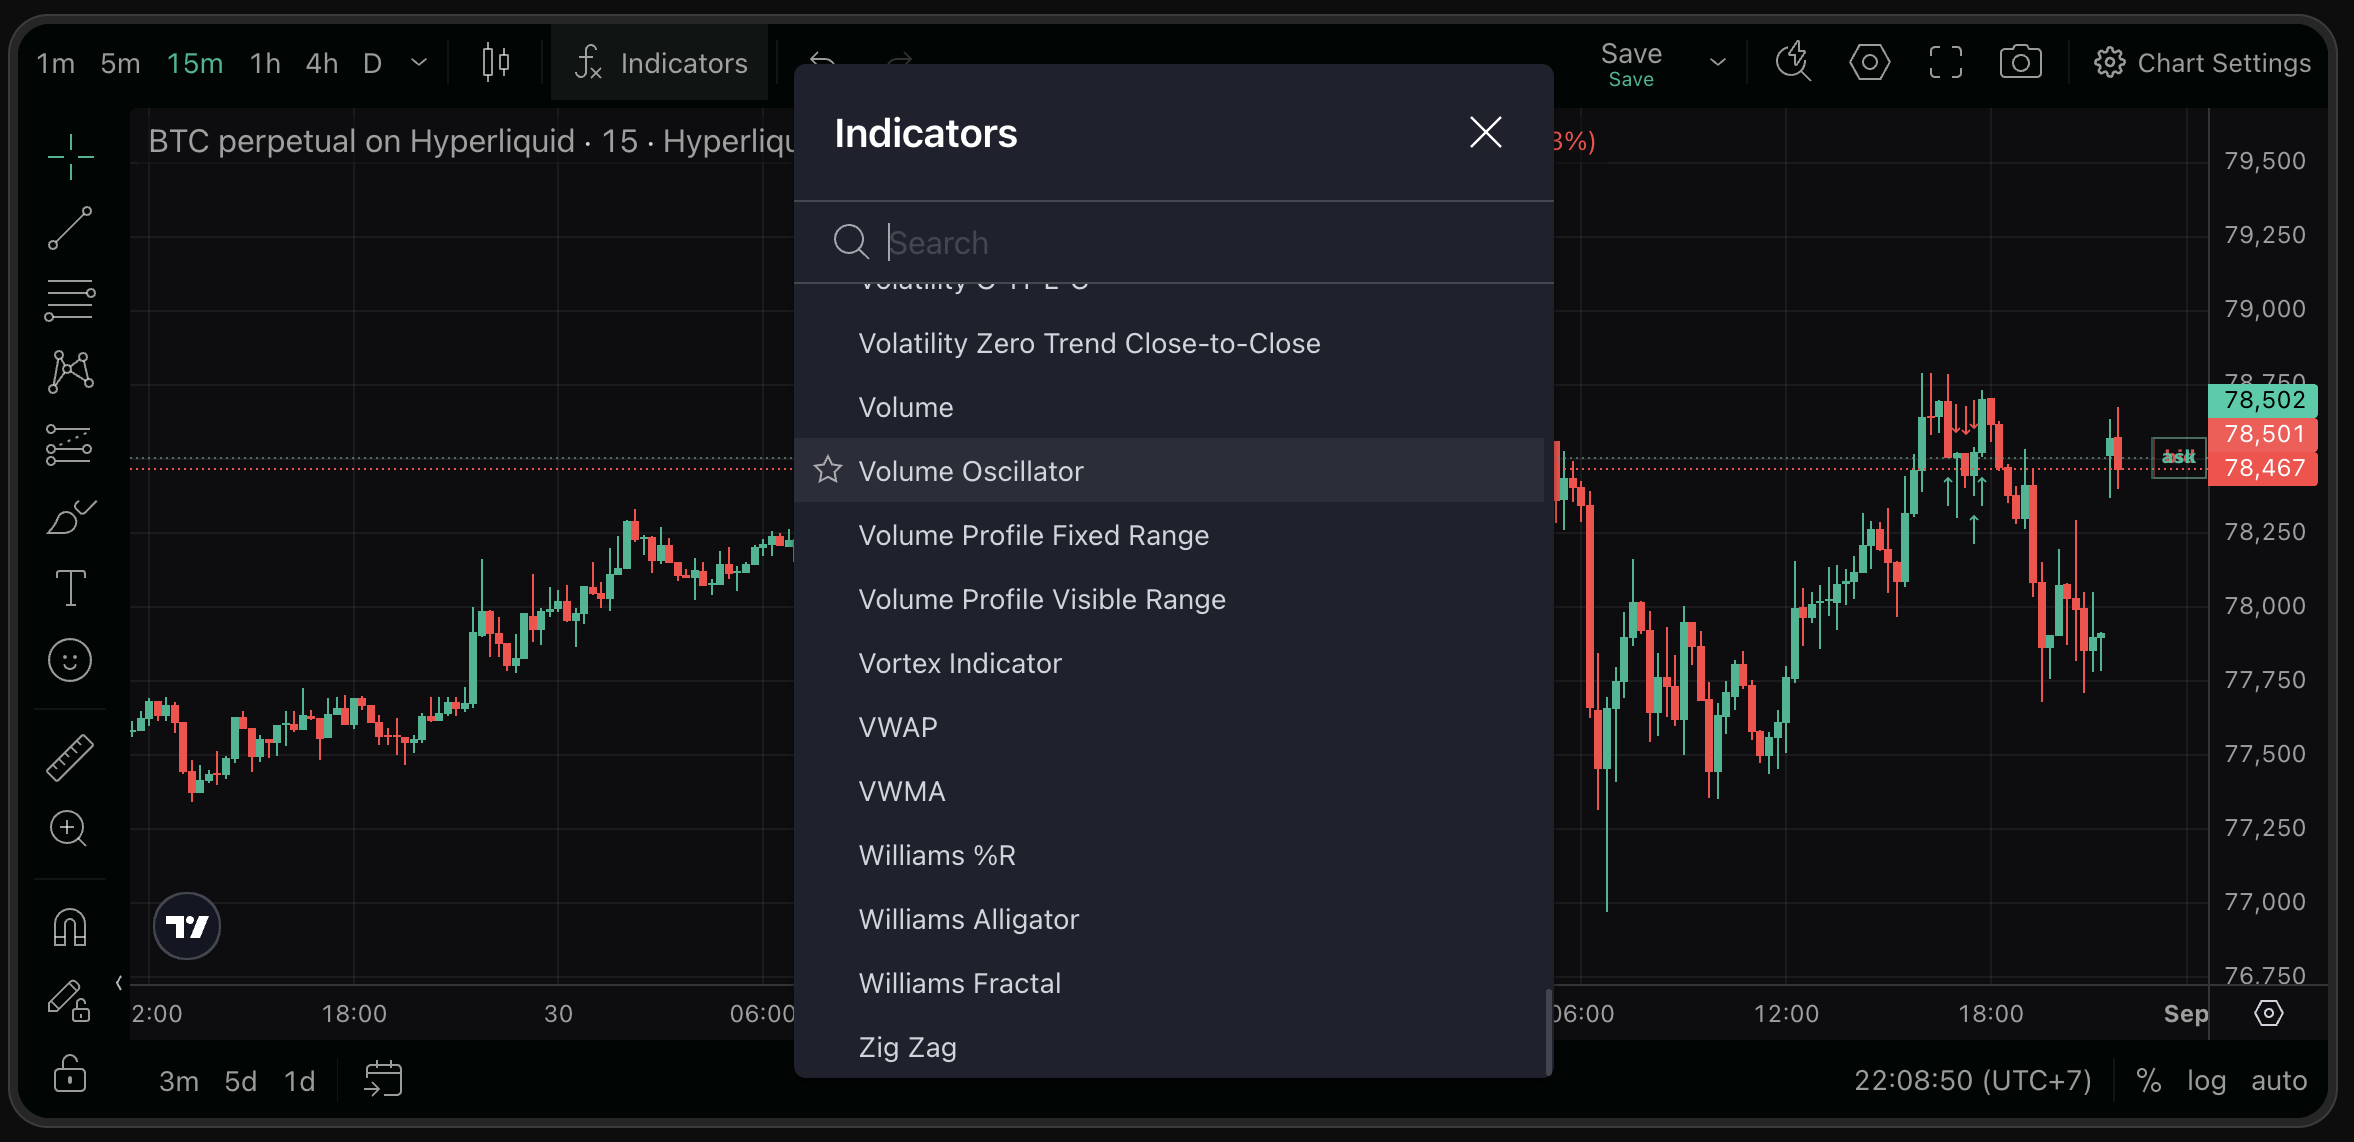
A: Click the fx icon in the chart toolbar (or press /) to open the Indicators panel. Search for any indicator (e.g., RSI, MACD, Bollinger Bands) and click to apply it. The panel is the standard TradingView indicator library — hundreds of built-ins are searchable here.
Q: What drawing tools are available?
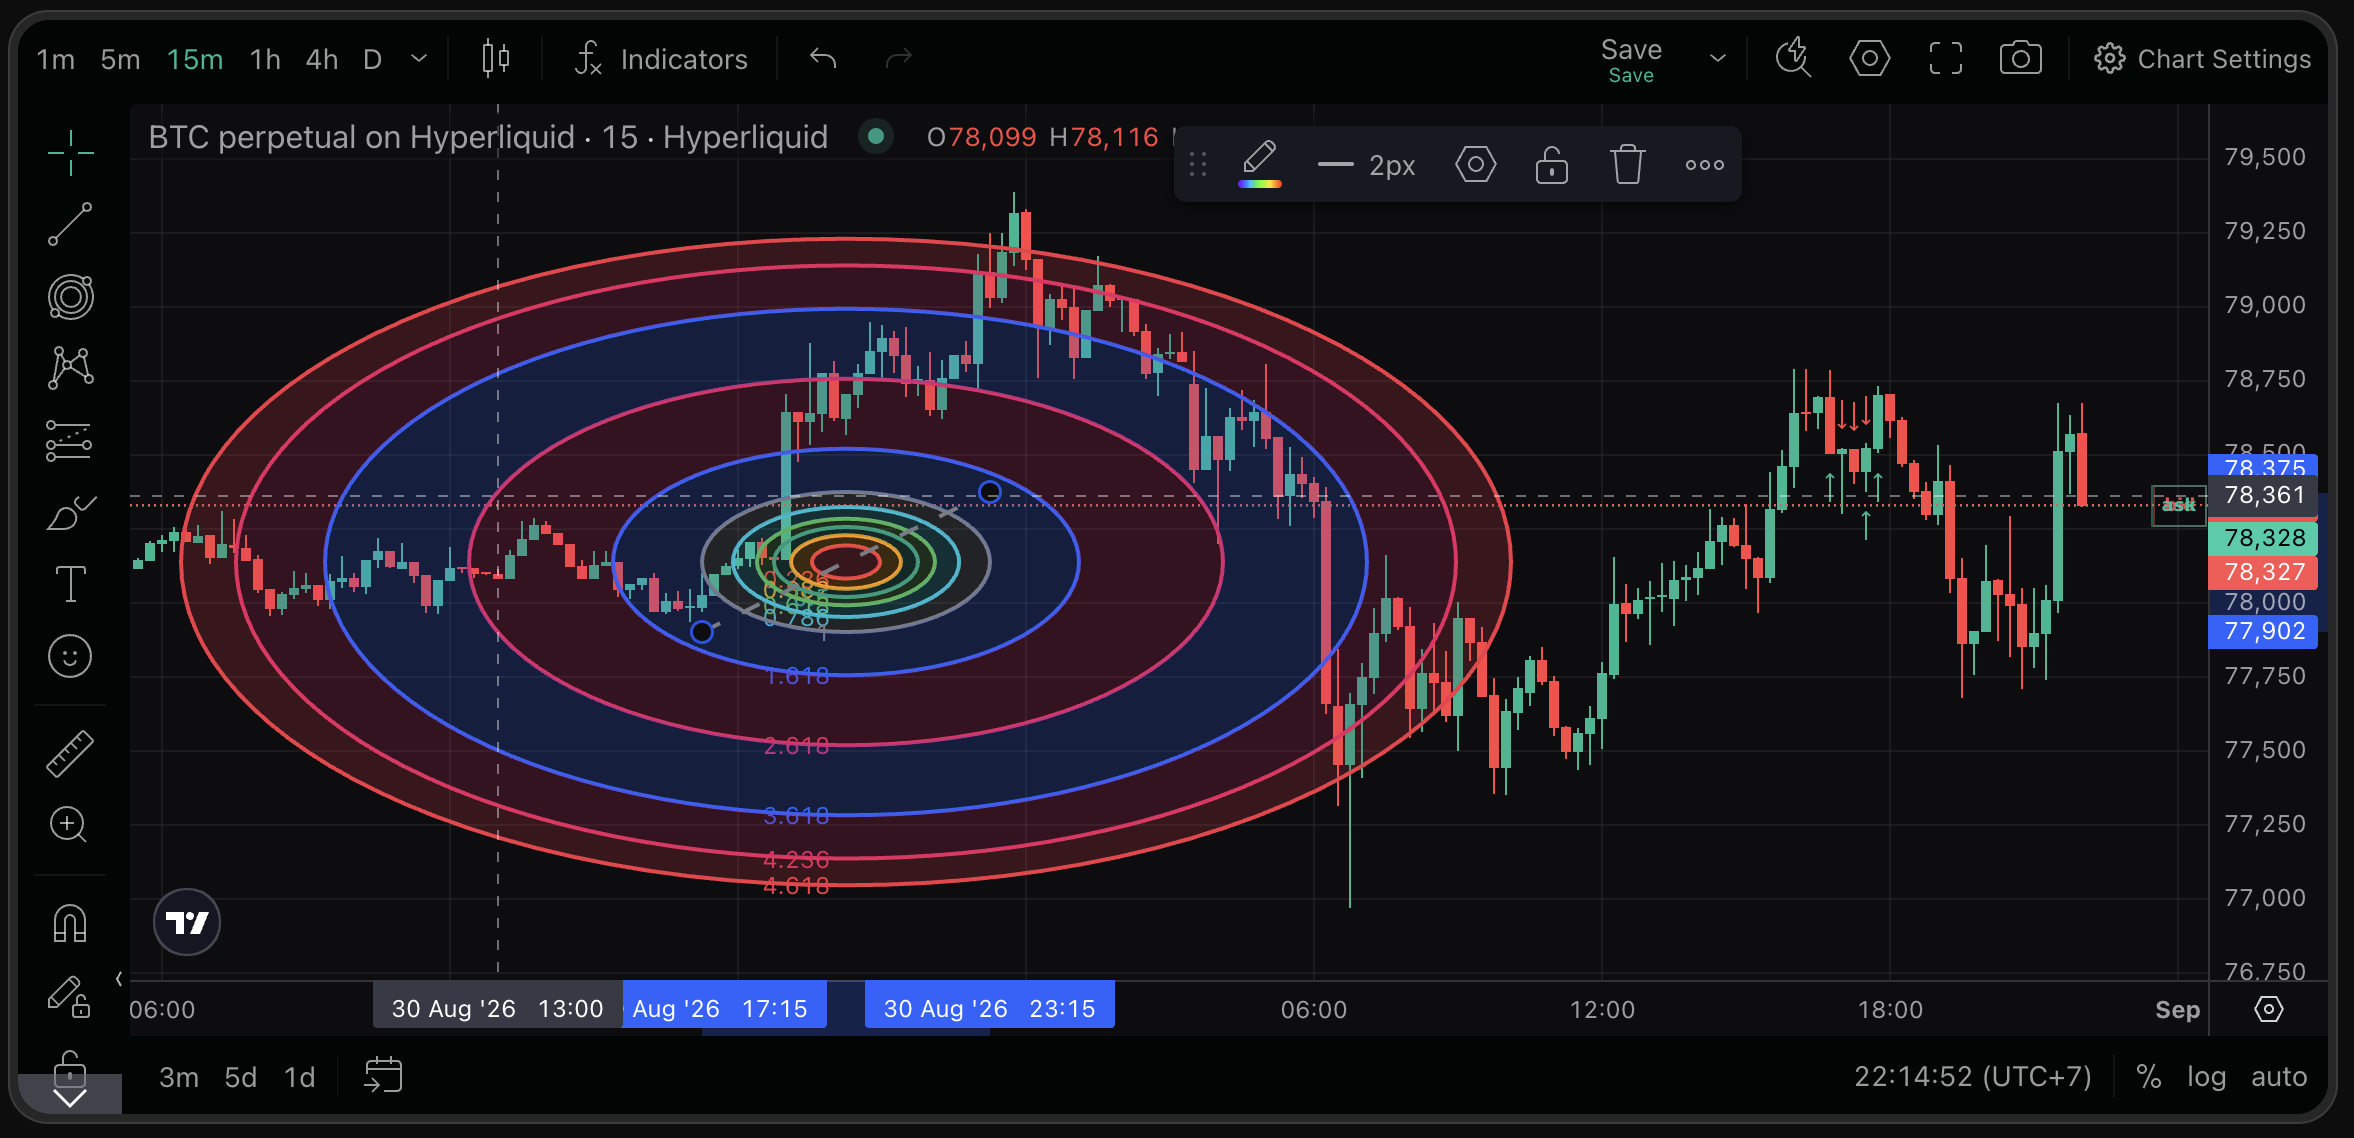
A: The drawing toolbar (left side of the chart) is the full TradingView tool set, organized into flyout groups rather than one flat list. Representative tools per group:
- Lines — Trend Line, Ray, Info Line, Extended Line, Trend Angle, Horizontal Line, Horizontal Ray, Vertical Line, Cross Line
- Channels — Parallel Channel and related channel tools
- Patterns — XABCD Pattern, Cypher Pattern, Head and Shoulders, ABCD Pattern, Triangle Pattern, Three Drives Pattern
- Elliott Waves — Impulse Wave, Correction Wave, Triangle Wave, and more
- Brush — freehand drawings
- Text (T) — custom text annotations
- Emoji/sticker annotations — new since the last revision
- Ruler / Measure — measure price and time distance between two points
- Zoom — magnify a chart region
- Magnet (bottom of the toolbar) — snaps drawings to the closest OHLC price value
Click the small chevron beside any grouped icon (for example, the Trend Line icon) to see its full flyout — that's where Fibonacci/pattern tools such as XABCD live.
Q: What keyboard shortcuts are available in the terminal?
A: In addition to chart-specific shortcuts (number keys for interval, / for Indicators, . to load a layout), the terminal now has a full G-prefixed navigation shortcut set — see Getting Started for the current table, or open Settings → Keyboard Shortcuts → View all shortcuts for the authoritative, in-app list.
Q: How do I save and load chart layouts?
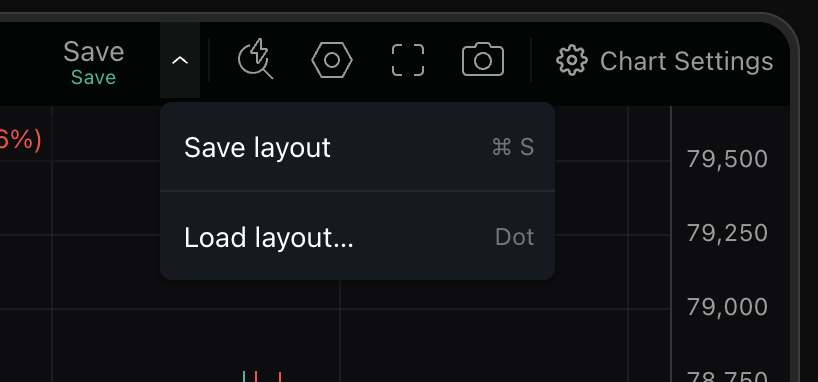
A: Use Save in the chart toolbar (its dropdown offers Save layout — ⌘S — and Load layout... — the . key) to save or restore your current chart layout (indicators, drawings, settings).
Q: Can I take a snapshot of the chart?
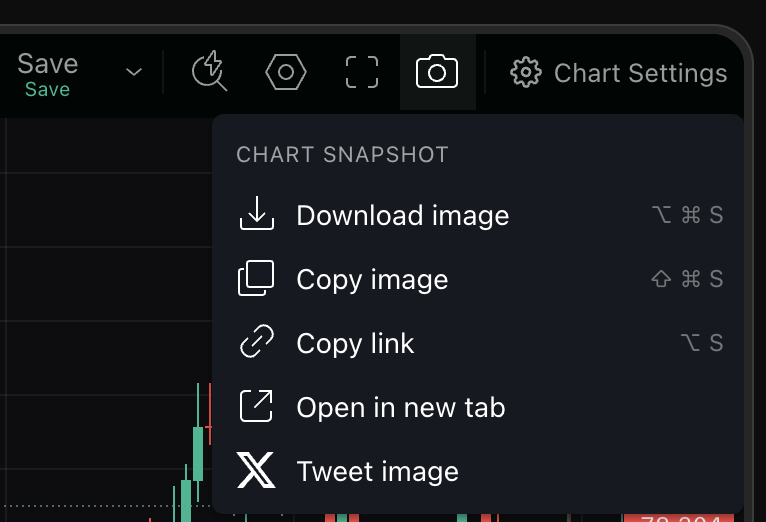
A: Yes — the camera icon in the chart toolbar opens a Chart Snapshot menu with five options: Download image, Copy image, Copy link, Open in new tab, and Tweet image. This replaces the previous single "Take a Snapshot" action with a small menu of export options.